Emulate a Redis Failover with Docker
Reading the Redis documentation can be a bit confusing without the hands-on experience. You could in theory create multiple processes of the Redis Server on your machine and configure each of them in part, but what if you could do it in a few commands? Not only that but emulate the network they’re connected to as well.
I’ve been looking into this and there’s a few examples out there on Web, the best one I could find was this one: https://github.com/AliyunContainerService/redis-cluster
So, starting from that example, I’ve tried to do the next best thing, which is to create a single docker-compose.yml file for all of it. Removing the need to build each image, just to do a docker-compose up and scale as needed.
Here’s what I got:
master:
  image: redis
slave:
  image: redis
  command: redis-server --slaveof master 6379
  links:
    - master
sentinel:
  image: redis
  command: >
    bash -c "echo 'port 26379' > sentinel.conf &&
    echo 'dir /tmp' >> sentinel.conf &&
    echo 'sentinel monitor master master 6379 2' >> sentinel.conf &&
    echo 'sentinel down-after-milliseconds master 5000' >> sentinel.conf &&
    echo 'sentinel parallel-syncs master 1' >> sentinel.conf &&
    echo 'sentinel failover-timeout master 5000' >> sentinel.conf &&
    cat sentinel.conf &&
    redis-server sentinel.conf --sentinel"
  links:
    - master
    - slave
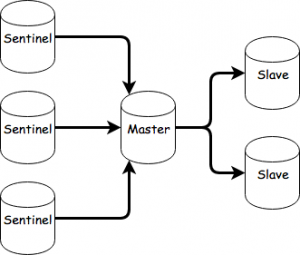
Basically, after saving this into a docker-compose.yml file and running docker-compose up in that folder you’ll get this:

You can now scale as needed. For example, by running:
docker-compose scale slave=2 sentinel=3
You’ll end up with:
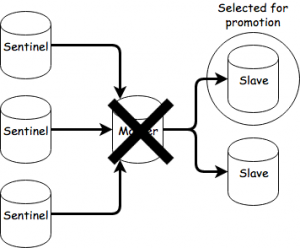
To initiale a failover, you’ll need to take the master out of the picture, you can do that with:
docker-compose pause master
You can now observe the communication between the sentinels and slaves. After the down-after-milliseconds and failover timeout passes, one of the slaves will be selected for promotion.
After the sentinels agree on the selection, the slave will become the new master.
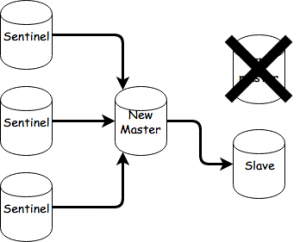
You can now unpause the old master by doing this:
docker-compose unpause master
The old master will now become a slave of the new master and perform a sync.
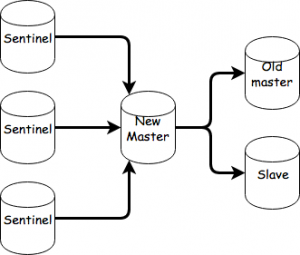
That’s about it. As an exercise you could try setting up a cluster starting from this and observe failovers there.
Debugging Golang apps in Docker with Visual Studio Code
Context
We’ve recently had some problems with a Go application that was running inside a Docker container in a very big Docker Compose setup.
After getting fed up with writing console prints and rebuilding the Docker image for that container and spinning up all the containers to debug things, we started investigating how we could speed up our debugging process.
Enter Visual Studio Code and its wonderful Go extension which supports Delve.
Now if you read through the pages linked above you will find out how to install and setup all these things. It’s pretty straight forward. The Docker part, however, is not. As such, I will show you a basic Go application which mimics what we had to deal with and how to set up debugging for it.
The application
The following is the main.go of our app. It will connect to a Redis server, set and get a value.
package main


import (
    "fmt"


    "github.com/garyburd/redigo/redis"
)


func main() {
    client, err := redis.Dial("tcp", "redis:6379")
    if err != nil {
        panic(err)
    }
    defer client.Close()


    result, err := client.Do("SET", "key1", "value1")
    if err != nil {
        panic(err)
    }
    fmt.Printf("%v\n", result)


    result, err = client.Do("GET", "key1")
    if err != nil {
        panic(err)
    }
    fmt.Printf("%v\n", result)
}
As you can see, it relies on the Redigo package, so make sure you get it and place it in your vendor folder.
To make sure you have everything setup the right way, go ahead and build it locally by running :
go build -o main main.go
If you run the application built this way, it will fail of course, because you need to connect to Redis. I’ve set the hostname for the server to redis which will point to an IP on the docker-machine when we docker-compose up.
The Dockerfile
Now we have to build the image for this application.
FROM golang


ENV GOPATH /opt/go:$GOPATH
ENV PATH /opt/go/bin:$PATH
ADD . /opt/go/src/local/myorg/myapp
WORKDIR /opt/go/src/local/myorg/myapp


RUN go get github.com/derekparker/delve/cmd/dlv
RUN go build -o main main.go
CMD ["./main"]
When this image will be built, it will basically copy the application code, set up the environment and build the Go application. The application’s entrypoint will be the main executable that will be built. We also install the Delve command line tool but we won’t use it if we run a container from this image directly (i.e. docker run).
Note the GOPATH variable and the path to which we copy our code. This path is very important for Delve and our debug configuration.
The Docker Compose file
Now that we have the Dockerfile to build the image, we have to define the docker-compose.yml file. Here, however we will overwrite the entrypoint for the container to launch Delve. Also the code that we copied will be replaced with a volume that will point to the code on the host machine, and we will also remove some security constraints that prevent Delve from forking the process.
Essentially, for the context I mentioned above we try not to touch the base image for the application since it might get accidentally pushed to the Docker Hub with debugging parameters. So in order to avoid that we have our Docker Compose process override the image with what we need to go about debugging.
Here’s the docker-compose.yml file :
version: '2'
services:
  redis:
    image: redis
    ports:
      - "6379:6379"
    expose:
      - "6379"
  myapp:
    build: .
    security_opt:
      - seccomp:unconfined
    entrypoint: dlv debug local/myorg/myapp -l 0.0.0.0:2345 --headless=true --log=true -- server
    volumes:
      - .:/opt/go/src/local/myorg/myapp
    ports:
      - "2345:2345"
    expose:
      - "2345"
It's here that we introduce the Redis server dependency we have. Note that for the myapp container we’ve exposed the ports that the Delve command line tool listens to.
So to see that everything is working, you can now run :
docker-compose up --build
This will build the image and start up the redis and myapp containers.
You should see the following output coming from the myapp container:
myapp_1  | 2016/12/15 08:50:39 server.go:71: Using API v1
myapp_1  | 2016/12/15 08:50:39 debugger.go:65: launching process with args: [/opt/go/src/local/myorg/myapp/debug server]
myapp_1  | API server listening at: [::]:2345
Which means that the Delve command line tool compiled our Go code into a debug executable, started it, and it’s listening for remote connections to the debugger on port 2345.
Now we just have to set up our launch.json config in the .vscode folder of our project.
The launch configuration
Here’s how our launch.json should look like:
{
    "version": "0.2.0",
    "configurations": [
       {
           "name": "Remote Docker",
           "type": "go",
           "request": "launch",
           "mode": "remote",
           "remotePath": "/opt/go/src/local/myorg/myapp",
           "port": 2345,
           "host": "192.168.99.100",
           "program": "${workspaceRoot}",
           "env": {},
           "args": []
       }
    ]
}
You might have to change the host IP to what your docker-machine ip output is.
Now all we have to do is set up a few breakpoints and start the debugger using the Remote Docker configuration.
Our docker compose terminal should print something like this from the myapp container :
myapp_1  | 2016/12/15 08:50:45 debugger.go:242: created breakpoint: &api.Breakpoint{ID:1, Name:"", Addr:0x4010af, File:"/opt/go/src/local/myorg/myapp/main.go", Line:11, FunctionName:"main.main", Cond:"", Tracepoint:false, Goroutine:false, Stacktrace:0, Variables:[]string(nil), LoadArgs:(*api.LoadConfig)(nil), LoadLocals:(*api.LoadConfig)(nil), HitCount:map[string]uint64{}, TotalHitCount:0x0}
myapp_1  | 2016/12/15 08:50:45 debugger.go:242: created breakpoint: &api.Breakpoint{ID:2, Name:"", Addr:0x401116, File:"/opt/go/src/local/myorg/myapp/main.go", Line:16, FunctionName:"main.main", Cond:"", Tracepoint:false, Goroutine:false, Stacktrace:0, Variables:[]string(nil), LoadArgs:(*api.LoadConfig)(nil), LoadLocals:(*api.LoadConfig)(nil), HitCount:map[string]uint64{}, TotalHitCount:0x0}
myapp_1  | 2016/12/15 08:50:45 debugger.go:242: created breakpoint: &api.Breakpoint{ID:3, Name:"", Addr:0x4013d1, File:"/opt/go/src/local/myorg/myapp/main.go", Line:22, FunctionName:"main.main", Cond:"", Tracepoint:false, Goroutine:false, Stacktrace:0, Variables:[]string(nil), LoadArgs:(*api.LoadConfig)(nil), LoadLocals:(*api.LoadConfig)(nil), HitCount:map[string]uint64{}, TotalHitCount:0x0}
myapp_1  | 2016/12/15 08:50:45 debugger.go:397: continuing
You can Next and Continue, look at the callstack, see the locals, view contents of specific variables, etc.
Final thoughts
I hope this proves to be as useful to you as it did for us. The tools mentioned in this post really save us a heap of trouble.
We really have to thank the open source community that brought us these tools. They are the real heroes.
Happy debugging!

