Using Negroni middleware in Golang for specific routes with httprouter
In the last days I’ve played a little bit with negroni middleware and httprouter router. I found that the documentation about how can we use negroni middlewares for specific routes with httprouter is pretty poor. So I decided to write this article to share with you what I’ve found.
Negroni is an idiomatic approach to web middleware in Golang which will help you build and stack middleware very easily. It comes with some default middlewares like:
- negroni.Recovery - Panic Recovery Middleware.
- negroni.Logger - Request/Response Logger Middleware.
- negroni.Static - Static File serving under the "public" directory.
But it also letting you create your own middlewares very easily:
func MyMiddleware(rw http.ResponseWriter, r *http.Request, next http.HandlerFunc) {
    // do some stuff before
    next(rw, r)
    // do some stuff after
}

…
n := negroni.New()
n.Use(negroni.HandlerFunc(MyMiddleware))
Negroni is BYOR (Bring your own Router) so we can use it with httprouter.
Httprouter is a Golang lightweight and high performance HTTP request router which is fast and has low memory consumption. TLDR: it is one of the fastest routers.
Here you have an example on how a simple route can be added when using httprouter:
router := httprouter.New()
router.POST("/login", loginHandler)
Where loginHandler will look like:
func loginHandler(w http.ResponseWriter, r *http.Request, params httprouter.Params) {
    // login controller logic
}
Now lets suppose you want to access GET profile endpoint but you need to be authenticated.
We will start by creating an authentication middleware:
// auth middleware
func auth(rw http.ResponseWriter, r *http.Request, next http.HandlerFunc) {
    // do some stuff before
    log.Println("auth middleware -> before executing controller")

    // call endpoint handler
    next(rw, r)

    // do some stuff after
    log.Println("auth middleware -> after the controller was executed")
}
Then we will create a handler which will return profile information after the authentication will be done. This handler will be sent to the auth middleware as a callback using "next" parameter:
func profileHandler(w http.ResponseWriter, r *http.Request) {
    fmt.Fprintf(w, "This is the content of the profile controller\n")
    log.Println("executing profile controller")
}
Now let’s send everything to the router:
nProfile := negroni.New()
// set the middleware
nProfile.Use(negroni.HandlerFunc(auth))
// set the handler
nProfile.UseHandlerFunc(profileHandler)
// attach negroni middleware and handler to our route
router.Handler("GET", "/profile", nProfile)
That was simple, but now if we have a route which contains parameters inside it (like /hello/:name) we cannot access it from our handler function. To solve that, I’ve written the following functions which will help us call the handler with the parameters:
// callwithParams function is helping us to call controller from middleware having access to URL params
func callWithParams(router *httprouter.Router, handler func(w http.ResponseWriter, r *http.Request, ps httprouter.Params)) func(w http.ResponseWriter, r *http.Request) {
    return func(w http.ResponseWriter, r *http.Request) {
        params := getUrlParams(router, r)
        handler(w, r, params)
    }
}

// getUrlParams function is extracting URL parameters
func getUrlParams(router *httprouter.Router, req *http.Request) httprouter.Params {
    _, params, _ := router.Lookup(req.Method, req.URL.Path)

    return params
}
And will be used like this:
router := httprouter.New()
nHello := negroni.New()
// add auth middleware
nHello.Use(negroni.HandlerFunc(auth))
// add handler using callWithParams function so we can access the URL parameters in handler
nHello.UseHandlerFunc(callWithParams(router, helloHandler))
router.Handler("GET", "/hello/:name", nHello)

n.UseHandler(router)

log.Fatal(http.ListenAndServe(":8080", n))
Using Negroni middleware in Golang for specific routes with httprouter
The full working example can be found here.
Mysqldump Through a HTTP Request with Golang
So, in a previous post I explained how one can backup all databases on a server, each in its own dump file. Let's take it to the next level and make a Golang program that will let us run the dump process with a HTTP request.
Assuming you already have Go installed on the backup server, create first a project directory in your home folder for example. Copy the mysql dump script from here and save it as dump.sh in your project folder. Modify ROOTDIR="/backup/mysql/" inside dump.sh to reflect current project directory.
Mysqldump
We will create a Golang script with two functions. One will launch the backup script when a specific HTTP request is done. The other one will put the HTTP call behind a authentication, so only people with credentials will be able to make the backup request.
package main

import (
	"encoding/base64"
	"fmt"
	"log"
	"net/http"
	"os"
	"os/exec"
	"strings"
)

var username = os.Getenv("DB_BACKUP_USER")
var password = os.Getenv("DB_BACKUP_PASSWORD")

func BasicAuth(w http.ResponseWriter, r *http.Request, user, pass string) bool {
	s := strings.SplitN(r.Header.Get("Authorization"), " ", 2)
	if len(s) != 2 {
		return false
	}
	b, err := base64.StdEncoding.DecodeString(s[1])
	if err != nil {
		return false
	}
	pair := strings.SplitN(string(b), ":", 2)
	if len(pair) != 2 {
		return false
	}
	return pair[0] == string(user) && pair[1] == string(pass)
}
func handler(w http.ResponseWriter, r *http.Request) {
	if BasicAuth(w, r, username, password) {
		cmd := exec.Command("bash", "dump.sh")
		stdout, err := cmd.Output()
		if err != nil {
			log.Fatal(err)
		}
		fmt.Fprintf(w, string(stdout))
		return
	}
	w.Header().Set("WWW-Authenticate", `Basic realm="Protected Page!!! "`)
	w.WriteHeader(401)
	w.Write([]byte("401 Unauthorized\n"))
}

func main() {
	http.HandleFunc("/backup", handler)
	http.ListenAndServe(":8080", nil)
}
This uses DB_BACKUP_USER and DB_BACKUP_PASSWORD that you will have to set as environment variables. Just append this to your ~/.bashrc file
export DB_BACKUP_USER="hello"
export DB_BACKUP_PASSWORD="password"
Now run source ~/.bashrc to load them.
Build the executable with go build http-db-backup.go where http-db-backup.go is the name of your Go file. Now you need to run the executable with sudo, but while preserving the environment: sudo -E ./http-db-backup
Now if you open your browser and open http://111.222.333.444:8080/backup (where 111.222.333.444 is your backup machine IP) the backup process will start, and you will get the output of the dump.sh in your browser when backup finishes.
We can furthermore add another function to list the directory in browser, so you can download the needed backup or backups.
func lister(w http.ResponseWriter, r *http.Request) {
	if BasicAuth(w, r, username, password) {
		http.FileServer(http.Dir(".")).ServeHTTP(w, r)
		return
	}
	w.Header().Set("WWW-Authenticate", `Basic realm="Protected Page!!! "`)
	w.WriteHeader(401)
	w.Write([]byte("401 Unauthorized\n"))
}
All you need to do is to add http.HandleFunc("/", lister) to your main() and navigate to http://111.222.333.444:8080/ . You will be able to navigate the backup directory to download the dump files.
Golang Guide: A List of Top Golang Frameworks, IDEs & Tools
Golang frameworks
Since its introduction, Google’s Go Programming Language (Golang) has been experiencing an increasing popularity among mainstream users. In a December 2016 survey, 89% of the 3,595 respondents claimed that they program in Go at work or outside of work.
Additionally, Go ranks highest among the programming languages in terms of expertise and preference. This July 2017, Go ranks 10th in Tiobe's Programming Language of the Year, jumping from its 55th ranking last year.
Clearly, Go is attracting many programmers from various disciplines and software development outsourcing professionals. And it’s safe to say that this is due to the ease of using Go.
As a compiled, open-source programming language, Go makes it easy for developers to build simple, reliable, and efficient software. It is the product of the innovation and evolution of the more conservative languages such as C and C++.
With Go, the amount of code typing is reduced and writing robust APIs without sacrificing its performance has become easier. Designed for scalability and concurrency, Go makes optimizations possible. A compiler can perform all the code inspection work before runtime.
We’ve compiled a list of the top frameworks, IDEs, and tools for Golang for your quick reference. Bookmark it on your browser so that you can come back whenever you’re working with Go!
Frameworks for Golang
Web frameworks help developers build applications as easily and quickly as possible. Go is still relatively new, so it’s important to use frameworks with sufficient documentation.
Here are 9 frameworks you can use to help you build projects using the Go Language.
1. Revel
As a high productivity framework for Go, Revel includes a Hot Code Reload tool that lets you rebuild your project on every file change. It also includes a wide variety of comprehensive and high-performance features, so you don’t need to find external libraries to integrate into the framework.
2. Beego
Beego is a full-fledged MVC framework with its own logging library, ORM, and web frameworks. You don’t need to find and install third-party libraries. It features a built-in tool called Bee Tool that watches out for code changes and runs tasks when changes are detected.
Beego will save you a lot of hours, especially in the beginning of a project when you’re figuring out the logging framework or application structure.

3. Martini
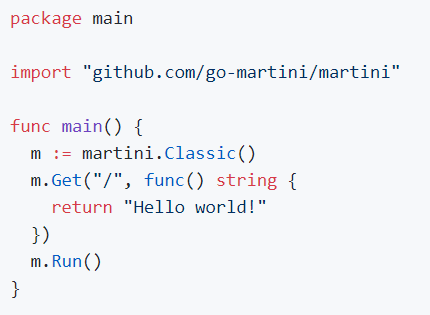
Inspired by Sinatra, Martini is an extremely light but powerful framework. It was developed for writing modular web applications and services in Golang.
It features a non-intrusive design that’s quick and easy to use and includes a wide range of handlers and middleware. It’s capable of performing basic routing, exception handling, and default document serving for AngularJS apps in HTML5 mode.

Martini’s best feature is its use of reflection, which lets developers dynamically insert data into the handler functions and add new services. Martini is also fully compatible with the http.HandlerFunc interface. The downside, though, is that the Martini framework is no longer maintained.
4. Gin Gonic
Gin Gonic is a web framework with a martini-like API, but with much better performance. If you’ve used Martini before, then you’ll be familiar with Gin Gonic. Otherwise, it will only take you 10 minutes to learn Gin. It’s that easy!
Gin Gonic is a minimalistic framework that includes only the most essential libraries and features. This makes it perfect for developing high-performance REST APIs. Plus, it’s 40 times faster than Martini.
You can add middleware, nested groups, JSON validation, and rendering, but it still maintains its optimum performance. Gin Gonic uses httprouter, the fastest HTTP router for Go.

5. Buffalo
Building new web applications with Go is quick and simple with Buffalo. When you’re starting a new project, Buffalo already has everything setup for you—from front-end to back-end development.
It features Hot Reloading, which means that dev command will watch your .go and .html files automatically. It will then rebuild and restart your binary for you. Just run the dev command, and you’ll see the changes go live right before your eyes!
Buffalo is more than just a framework – it’s a holistic web development eco-system that lets you get straight to building your application.

6. Goji
Goji is a lightweight and fast web framework that has composability and simplicity as its main priority. Much like net/http.ServeMux, Goji is a minimalistic HTTP request multiplexer. It includes Einhorn support, which makes it possible for you to have websocket support in Goji.
Additional features include URL patterns, re-configurable middleware stack, graceful shutdown, and more. Goji can be used in production and has served billions of requests across several organizations.

7. Tiger Tonic
Inspired by Dropwizard, Tiger Tonic is a Go framework for developing JSON web services and building high-performance REST APIs. To stay true to the principles of Golang, Tiger Tonic strives to keep features orthogonal.
The downside to Tiger Tonic is its inadequacy when it comes to building large, back-end applications.

8. Gocraft
Another powerful yet minimalistic framework, Gocraft offers fast and scalable routing performance. It adds routing to the net/http package from the standard library.
Gocraft is a Go mux and middleware package that features casting and reflection capabilities so that you can type your code statically. You can also add an optional functionality with the built-in middleware or write your own.
Since performance is always one of the top concerns for developers, Gocraft is a great choice for developers. It’s very easy to write backend web applications using the Gocraft framework.

9. Mango
Although Mango is not actively maintained by its creator, Paul Bellamy, a lot of Go users still use it. The great thing about Mango is its modularity. You can choose from a variety of libraries to include in your project.
Mango lets you build reusable modules of HTTP functionality as quickly and easily as possible. It compiles a list of middleware and application into a single http server object to keep your code self-contained.

Integrated Development Environment (IDEs) for Golang
IDEs for Golang are gaining popularity, along with the Go Language. While many developers still prefer to use text editors, many prefer to use IDEs as well.
If you’re working on a large-scale project with an extensive codebase, an IDE can help you organize your code and navigate it with ease. Furthermore, IDEs can help you test your code and edit them accordingly.
Here are the top IDEs that work great with Golang.
1. Gogland
Software development company JetBrains released another reliable IDE, but this time, for Golang. Gogland is a commercial IDE that provides a robust ergonomic environment for Go developers. It also features coding assistance, debugger, and an integrated terminal.
Because an established company created Gogland, it has an extensive IntelliJ plugin ecosystem where you can get additional tools should you need more.

2. Visual Studio Code
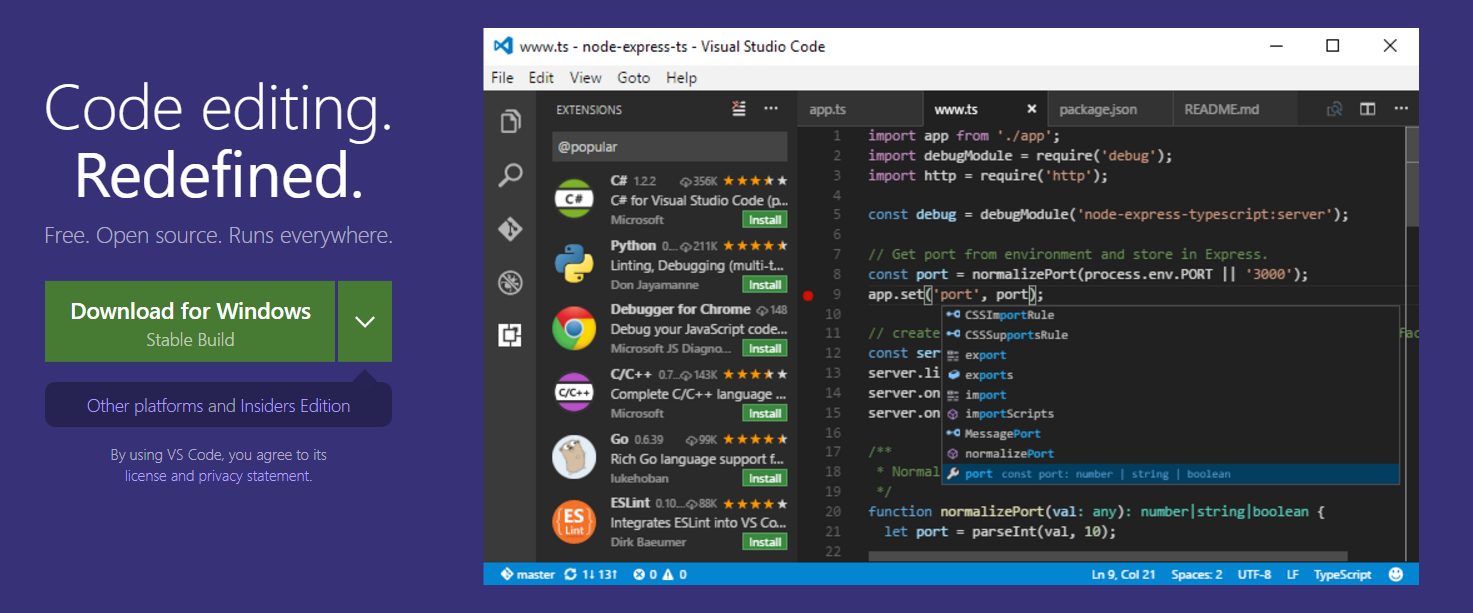
Created by Microsoft, Visual Studio Code is a full-featured, open-source IDE and code editor that supports a wide variety of programming languages. It features smart completion with IntelliSense; debugging using break points, call stacks, and an interactive console; built-in Git integration; and hierarchical folder and file explorer.
As another popular IDE, Visual Studio Code has a supportive community of Go developers that regularly contribute. With Visual Studio Code, you can extend functionalities with the array of available plugins.
3. LiteIDE
LiteIDE is among the first Golang-centric, open-source IDEs that was created more than 5 years ago. As a C++ Qt application with a unique look and feel, LiteIDE offers code management, configurable build commands, gdb and Delve debugger, auto-completion and theming with WordApi, MIME type based system, and more. It also provides JSON and Golang support.

4. Wide
Wide is a web-based IDE for Golang programmers. It’s designed for collaborative development and works best for teams and web development agencies. Wide features include code highlight, debugging, Git integration, and more.
Because Wide is created and maintained by a Chinese developer, most of its documentation and support are in Chinese.

5. Atom with go-plus plugin
If you’re already using Atom, your code editing experience in Golang can be improved with an open-source package called go-plus. With go-plus, you get instant, real-time feedback on your syntax and build errors.
The go-plus package offers almost all Golang support in Atom. It can also be used for tools, build flows, linters, vet and coverage tools.
Go-plus also includes various code snippets and features such as autocomplete with gocode, code formatting with gofmt, goreturns, or goimports, and more.

6. Eclipse with GoClipse
Because Eclipse is a widely popular IDE, numerous plugins have been created for it. GoClipse is an Eclipse plugin for Golang that offers Go source code editing with configurable syntax highlighting and automatic indentation and brace completion.
GoClipse also serves as a project wizard and builder that reports syntax and build errors instantly. Additional features of GoClipse include debugging functionality and code assist.
7. Sublime Text with GoSublime
Sublime Text is another sophisticated text editor with a large community of contributors and developers. As such, a wide variety of plugins has been created for this IDE.
GoSublime is a Golang plugin for Sublime Text 3 that offers code completion from Gocode, lint/syntax check while you’re wiring code, automatic addition and removal of package imports, and more.

8. Vim with vim-go plugin
Vim is a free, open-source IDE that can be customized and configured with various plugins. If you’re a Golang programmer, you can use Vim with the vim-go plugin created by Fatih Arslan. Vim-go automatically installs all the necessary binaries for providing a smooth Vim integration for Golang.
Vim-go is a powerful plugin suite for writing and developing Go. Its features include advanced source code analysis, adding and removing import paths, multiple 3rd liner support, goto definition, quick file executions, and much more.
Vim-go is highly customizable, with individual features that can be enabled or disabled according to your need.
9. Komodo
Komodo is a full-featured Go language IDE that supports other programming languages such as Node.js, Python, Ruby, Perl, and more. With this Go IDE, you can write clean code easily. Its features include an advanced code editor, intelligent code completion, syntax checking, version control and unit testing, and a Go Code Intelligence that allows code browsing and code hinting.
The great thing about Komodo is that it works great for team collaboration since multiple developers can edit a document simultaneously. Komodo can be installed on Mac, Windows, or Linux with just one license.

10. IntelliJ IDEA with Go Language (golang.org) Support Plugin
IntelliJ IDEA (same company as JetBrains) is an IDE that can be used with Golang through the Go language support plugin. If you want to use IntelliJ IDEA with Golang, you need to install this plugin, albeit with limited features as opposed to Gogland.

Tools for Golang
Golang tools can be used for a wide variety of projects and web applications. Developers can write code and build applications as quickly and easily as possible with these helpful tools.
Here’s a list of the top Golang tools for your reference.
1. Apicompat
Apicompat is a new Go language tool that helps developers detect backwards, incompatible changes and exported declarations.
With Apicompat, you can avoid false positives. However, not every backwards incompatible change can be detected by Apicompat. Swapping argument parameters and other changes still need to be considered by the library author.

2. Checkstyle
Inspired by Java Checkstyle, Checkstyle for Golang prints out coding style suggestions. It also lets developers check file line/function and line/param number, which can then be configured by the user.

3. Depth
Depth is another useful Golang tool that helps web developers retrieve and visualize Go source code dependency trees. It can be used as a standalone command-line application or as a particular package within your own project. You can add customizations by simply setting the appropriate flags on the Tree before resolving.

4. Go-Swagger
This toolkit includes a wide variety of features and functions. Go-Swagger is an implementation of Swagger 2.0, and can serialize and deserialize swagger specifications. It’s a minimalist yet powerful representation of your RESTful API.
With Go-Swagger, you can swagger spec document, validate against jsonschema, and other extra rules. Other features include code generation, API generation based on swagger specs, spec document generation based on the code, extended string formats, and more.
5. Go Meta Linter
If you need to run Go lint tools and normalize their output concurrently, that’s exactly what Go Meta Linter can do for you. Go Meta Linter is intended to be used with a text editor or an IDE integration such as Sublime Linter plugin, Atom go-plus package, Emacs Flycheck checker, Vim/Neovim, and Go for Visual Studio Code. It also supports a wide variety of linters and configuration files like JSON.

6. Go-callvis
Go-callvis is a web development tool that allows you to visualize the call graph of your Go program with Graphviz's dot format. This tool is especially useful when building large projects with complex codebases. This is also useful when you want to understand another developer’s code structure or rebuild someone else’s project.
With go-callvis, developers can focus specific package within a program; group functions according to package and methods according to type; and limit packages to custom path prefixes, and ignore those that contain them.

7. Gonative
Gonative is a simple Golang tool that lets you build Go toolchains with native libs, which can be cross-compiled while still utilizing the Cgo-enabled versions of the stdlib packages.
Gonative downloads the binary distributions for each platform and copies their libraries into its proper places. At the same time, Gonative sets the correct mod time to avoid unnecessary rebuilds.
Unfortunately, Gonative remains untested on Windows. Additionally, there’s no Linux/arm support provided.

8. Grapes
Grapes is a lightweight Golang tool designed to distribute commands over ssh easily. It’s written and actively maintained by Yaron Sumel.
Grapes will soon support full host key validation, so that’s something developers should watch out for.

9. Gosimple
The great thing about this Golang linter is that it focuses on simplifying Go source code. Gosimple always targets the latest Go version, so it requires Go version 1.6 or later.
If there’s a new Go release, gosimple will suggest the easiest and simplest methods to avoid complicated constructs.

10. Go Vendor
Go Vendor is the Golang tool that works with the standard Vendor folder. It allows developers to copy existing dependencies from $GOPATH with govendor add/update. You can also directly pull new dependencies or update existing dependencies with govendor fetch and move legacy systems with govendor migrate.

Wrapping It Up
If you’re coming from a JS/Node background, you need to learn some new programming concepts such as coroutines, channels, strict typing with compilation, interfaces, structs, pointers, and some other differences. But, once you get into the groove, you’ll find Golang easier and faster to use.
Profiling web applications in Golang
I've been watching the 2017 Gophercon videos from here. There are many good talks that I would recommend watching from that list.
One that I really wanted to try out on my own was the profiling presentation that Peter Bourgon did. I assume for the sake of simplicity, he left some details out. I've been trying to figure them out on my own.
I was inspired to try to profile my own Golang web apps using the method he presented in his talk. So in this post I'll show you a simplified example of how to profile your own web applications in more detail.
The web app
To see a practical example of profiling and to keep it simple, we need to create a web app that when called on a particular route, performs some sort of calculation and returns a result in it's payload.
If we were to mimic real life scenarios, we would be here all day. So just to keep it simple, we will create a single route that calculates the 25th Fibonacci number when it's called and returns it in the response body.
I've written two versions of the Fibonacci function before hand, one that performs recursion (exponential time - very CPU intensive) and one that calculates the number using a vector (linear time - not very CPU intensive).
In order to use the profiling tool, you need to import the net/http/pprof package and register some routes. In the presentation I mentioned earlier, the speaker mentioned that we could leave this imported even in production environments since it does not affect performance.
package main

import (
	"fmt"
	"log"
	"net/http"
	"net/http/pprof"
)

// O(n) Fibonacci
func linearFibonacci(n int) int {
	// Create an int array of size n + 1
	v := make([]int, n+1)

	// F(0) = 0
	v[0] = 0
	// F(1) = 1
	v[1] = 1

	// F(i) = F(i-1) + F(i-2)
	for i := 2; i <= n; i++ {
		v[i] = v[i-1] + v[i-2]
	}

	// F(n) - return the n-th Fibonacci number
	return v[n]
}

// O(2^n) Fibonacci
func exponentialFibonacci(n int) int {
	// F(0) = 0
	if n == 0 {
		return 0
	}

	// F(1) = 1
	if n == 1 {
		return 1
	}

	// F(n) = F(n-1) + F(n-2) - return the n-th Fibonacci number
	return exponentialFibonacci(n-1) + exponentialFibonacci(n-2)
}

// HTTP request handler
func handler(w http.ResponseWriter, r *http.Request) {
	// return the 25th Fibonacci number in the response payload
	fmt.Fprintf(w, "%d", exponentialFibonacci(25))
}

func main() {
	// Create a new HTTP multiplexer
	mux := http.NewServeMux()

	// Register our handler for the / route
	mux.HandleFunc("/", handler)

	// Add the pprof routes
	mux.HandleFunc("/debug/pprof/", pprof.Index)
	mux.HandleFunc("/debug/pprof/cmdline", pprof.Cmdline)
	mux.HandleFunc("/debug/pprof/profile", pprof.Profile)
	mux.HandleFunc("/debug/pprof/symbol", pprof.Symbol)
	mux.HandleFunc("/debug/pprof/trace", pprof.Trace)

	mux.Handle("/debug/pprof/block", pprof.Handler("block"))
	mux.Handle("/debug/pprof/goroutine", pprof.Handler("goroutine"))
	mux.Handle("/debug/pprof/heap", pprof.Handler("heap"))
	mux.Handle("/debug/pprof/threadcreate", pprof.Handler("threadcreate"))

	// Start listening on port 8080
	if err := http.ListenAndServe(":8080", mux); err != nil {
		log.Fatal(fmt.Sprintf("Error when starting or running http server: %v", err))
	}
}
As you can see, this is a really simple application, save it to a file called main.go and build it like this: go build -o myserver main.go .
Now you can run your binary: ./myserver and to check if it's working we'll send a request to it:
$ curl http://localhost:8080
75025
The CPU profile
Now, while the server is running, you will need to run two commands in parallel. You first need to start the profiling tool which will record data for 30 seconds after it is run AND as it is running, run the Apache Benchmark tool to send a few requests it's way.
So you will need to run the profiling tool like this:
go tool pprof -seconds 30 myserver http://localhost:8080/debug/pprof/profile
While that's running, run the benchmark:
ab -k -c 8 -n 100000 "http://127.0.0.1:8080/"
This will create a total of 100,000 keep-alive requests to your server, using 8 cores. To better understand what this benchmark command does, it is explained in the link provided.
After 30 seconds, the profiling tool will show a prompt for commands that will look something like this:
$ go tool pprof -seconds 30 myserver http://localhost:8080/debug/pprof/profile
Fetching profile from http://localhost:8080/debug/pprof/profile?seconds=30
Please wait... (30s)
Saved profile in /Users/username/pprof/pprof.myserver.localhost:8080.samples.cpu.013.pb.gz
Entering interactive mode (type "help" for commands)
(pprof)
Here you can run commands to show you how much of CPU time each function took and other useful information. For example, if I run top5 it will list the top 5 functions that are hogging the CPU:
(pprof) top5
84.57s of 85.18s total (99.28%)
Dropped 87 nodes (cum <= 0.43s)
Showing top 5 nodes out of 30 (cum >= 1.09s)
      flat  flat%   sum%        cum   cum%
    51.93s 60.97% 60.97%     51.93s 60.97%  main.exponentialFibonacci
    20.57s 24.15% 85.11%     20.59s 24.17%  fmt.(*pp).doPrintf
    12.06s 14.16% 99.27%     12.06s 14.16%  syscall.Syscall
     0.01s 0.012% 99.28%     11.22s 13.17%  net.(*netFD).Write
         0     0% 99.28%      1.09s  1.28%  bufio.(*Reader).ReadLine
As you can see the exponentialFibonacci function really hogs the CPU.
Please note: These values might differ on your machine. For reference I'm using a MacBook Pro (Retina, 13-inch, Early 2015), 2.7 GHz Intel Core i5 Processor and 8 GB 1867 MHz DDR3 of Memory.
If we wanted to see a graph of this profile we need to run the web command like this:
(pprof) web
(pprof)
This will open up your default browser and display an image of the profile. Here's a crop of the image that concerns our Fibonacci function:
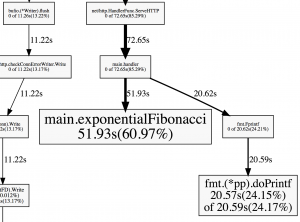
So during that profile, 60.97% of the time, the exponentialFibonacci was running on the CPU.
Optimizations
Now, we know from the theory that O(n) < O(2^n). Let's see if this holds up in practice, it we were to replace the exponentialFibonacci call with linearFibonacci inside the handler function.
Now we run the profile again. You can immediately see that it took less time because the benchmark actually finishes really fast this time.
If we run top5 now, the linearFibonacci function doesn't even make the cut. Even if you try to do top100 you will not find it because the compiler inlined that particular code.
So we need to rebuild the application with the compiler flags that disable inlining like this:
go build -gcflags -l -o myserver main.go
Now even with this flag enabled I had a hard time finding the function in the top. I went ahead and increased the hard-coded value for the n-th Fibonacci number to 10,000. So I'm looking for the 10,000th Fibonacci number, this number doesn't even fit inside the integer datatype in Golang. It will overflow several times before coming to a stop. I also increased the benchmark to 1,000,000 requests.
Now if I run top5 I get:
(pprof) top5
36.21s of 46.49s total (77.89%)
Dropped 226 nodes (cum <= 0.23s)
Showing top 5 nodes out of 102 (cum >= 1.97s)
      flat  flat%   sum%        cum   cum%
    25.94s 55.80% 55.80%     26.23s 56.42%  syscall.Syscall
     3.38s  7.27% 63.07%      3.38s  7.27%  runtime.kevent
     2.60s  5.59% 68.66%      2.60s  5.59%  runtime.usleep
     2.32s  4.99% 73.65%      4.26s  9.16%  main.linearFibonacci
     1.97s  4.24% 77.89%      1.97s  4.24%  runtime.mach_semaphore_signal
Or in graphical format:
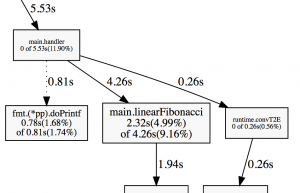
As you can see, it barely even makes a dent.
So for this test, calculating the 25th Fibonacci number recursively takes 60% of the CPU while calculating the 10,000th Fibonacci number linearly takes 4% of the CPU (without inlining).
Another useful command for pprof to see how much CPU time a function takes is the list command. Or, if you're like me, to find out if a function is actually called.
For our linearFibonacci function it looks like this:
(pprof) list linearFibonacci
Total: 46.49s
ROUTINE ======================== main.linearFibonacci in /Users/username/workspace/go/src/github.com/username/test_profiling/main.go
     2.32s      4.26s (flat, cum)  9.16% of Total
         .          .      8:)
         .          .      9:
         .          .     10:// O(n) Fibonacci
         .          .     11:func linearFibonacci(n int) int {
         .          .     12:	// Create an int array of size n + 1
      10ms      1.95s     13:	v := make([]int, n+1)
         .          .     14:
         .          .     15:	// F(0) = 0
         .          .     16:	v[0] = 0
         .          .     17:	// F(1) = 1
         .          .     18:	v[1] = 1
         .          .     19:
         .          .     20:	// F(i) = F(i-1) + F(i-2)
     260ms      260ms     21:	for i := 2; i <= n; i++ {
     2.05s      2.05s     22:		v[i] = v[i-1] + v[i-2]
         .          .     23:	}
         .          .     24:
         .          .     25:	// F(n) - return the n-th Fibonacci number
         .          .     26:	return v[n]
         .          .     27:}
A better comparison
A better way to compare the two methods, and the theory to practice, is this:
- Knowing that the exponentialFibonacci method is O(2^n), it would take approximately 2^25 = 33554432 instructions to calculate the 25th Fibonacci number.
- Linearly, calculating the 33554432th Fibonacci number should take roughly the same time as calculating the 25th number exponentially.
So following the methodology above we do this:
- Build the application using the exponentialFibonacci(25) call.
- Start the application.
- Start the Apache Benchmark for 1,000,000 requests.
- Start the CPU profile for 30s seconds.
We get this:
(pprof) top5
98.27s of 99.02s total (99.24%)
Dropped 64 nodes (cum <= 0.50s)
Showing top 5 nodes out of 30 (cum >= 1.30s)
      flat  flat%   sum%        cum   cum%
    60.78s 61.38% 61.38%     60.78s 61.38%  main.exponentialFibonacci
    24.54s 24.78% 86.16%     24.54s 24.78%  fmt.(*pp).doPrintf
    12.95s 13.08% 99.24%     12.95s 13.08%  syscall.Syscall
         0     0% 99.24%      1.30s  1.31%  bufio.(*Reader).ReadLine
         0     0% 99.24%      1.30s  1.31%  bufio.(*Reader).ReadSlice
Now for the second part:
- Build the application using the linearFibonacci(33554432) call.
- Start the application.
- Start the Apache Benchmark for 1,000,000 requests.
- Start the CPU profile for 30s seconds.
We get this:
(pprof) top5
49280ms of 49870ms total (98.82%)
Dropped 92 nodes (cum <= 249.35ms)
Showing top 5 nodes out of 29 (cum >= 470ms)
      flat  flat%   sum%        cum   cum%
   28650ms 57.45% 57.45%    44400ms 89.03%  main.linearFibonacci
   15660ms 31.40% 88.85%    15660ms 31.40%  runtime.memclr
    3910ms  7.84% 96.69%     3910ms  7.84%  runtime.usleep
     590ms  1.18% 97.87%      590ms  1.18%  runtime.duffcopy
     470ms  0.94% 98.82%      470ms  0.94%  runtime.mach_semaphore_timedwait
As you can see, the flat percentages, which is how much of the time was spent in the routine itself, is roughly the same. 61.38% vs 57.45%, it's about 4% difference between them.
Profiling memory
Using the same process, you can run the following command to profile memory:
go tool pprof -alloc_objects myserver http://localhost:8080/debug/pprof/heap
If you run a top command you should see something like this:
(pprof) top10
9741685 of 9927382 total (98.13%)
Dropped 7 nodes (cum <= 49636)
Showing top 10 nodes out of 33 (cum >= 99079)
      flat  flat%   sum%        cum   cum%
   3182489 32.06% 32.06%    3182489 32.06%  net/textproto.(*Reader).ReadMIMEHeader
   2050835 20.66% 52.72%    2050835 20.66%  context.WithCancel
   1068043 10.76% 63.47%    8447075 85.09%  net/http.(*conn).readRequest
    675175  6.80% 70.28%    5155947 51.94%  net/http.readRequest
    667729  6.73% 77.00%     667729  6.73%  net/url.parse
    655370  6.60% 83.60%    1414760 14.25%  main.handler
    618866  6.23% 89.84%     618866  6.23%  main.linearFibonacci
    589833  5.94% 95.78%     589833  5.94%  net/textproto.(*Reader).ReadLine
    134266  1.35% 97.13%     172250  1.74%  net/http.newBufioWriterSize
     99079     1% 98.13%      99079     1%  sync.(*Pool).pinSlow
Conclusion
Now that you've seen the basics on how to profile your Golang web apps, you can start diving into heavier stuff like this. Take some time and run a profile on your own Golang web apps.
Also, you should see the Gophercon talk I mentioned at the start of this post, it's quite good.
Counting lines and words using Go
For those who need to count words and lines in text files, an easy approach for this matter is to use bufio.ScanWords and bufio.ScanLine in order to quickly solve the problem.
To count words:
input := "Spicy jalapeno pastrami ut ham turducken.\n Lorem sed ullamco, leberkas sint short loin strip steak ut shoulder shankle porchetta venison prosciutto turducken swine.\n Deserunt kevin frankfurter tongue aliqua incididunt tri-tip shank nostrud.\n"
scanner := bufio.NewScanner(strings.NewReader(input))

// Set the split function for the scanning operation.
scanner.Split(bufio.ScanWords)

// Count the words.
count := 0
for scanner.Scan() {
    count++
}

if err := scanner.Err(); err != nil {
    fmt.Fprintln(os.Stderr, "reading input:", err)
}

fmt.Printf("%d\n", count)
ScanWords is a split function for a Scanner that returns each space-separated (checks unicode.IsSpace) word of text, with trimmed whitespace.
To count lines:
input := "Spicy jalapeno pastrami ut ham turducken.\n Lorem sed ullamco, leberkas sint short loin strip steak ut shoulder shankle porchetta venison prosciutto turducken swine.\n Deserunt kevin frankfurter tongue aliqua incididunt tri-tip shank nostrud.\n"
scanner := bufio.NewScanner(strings.NewReader(input))

// Set the split function for the scanning operation.
scanner.Split(bufio. ScanLines)

// Count the lines.
count := 0
for scanner.Scan() {
    count++
}

if err := scanner.Err(); err != nil {
    fmt.Fprintln(os.Stderr, "reading input:", err)
}

fmt.Printf("%d\n", count)
ScanLines is a split function for a Scanner that returns each line of text (separated by "\r?\n"). It returns also empty lines and the last line is returned even if it has no newline at the end.
Debugging Golang apps in Docker with Visual Studio Code
Context
We’ve recently had some problems with a Go application that was running inside a Docker container in a very big Docker Compose setup.
After getting fed up with writing console prints and rebuilding the Docker image for that container and spinning up all the containers to debug things, we started investigating how we could speed up our debugging process.
Enter Visual Studio Code and its wonderful Go extension which supports Delve.
Now if you read through the pages linked above you will find out how to install and setup all these things. It’s pretty straight forward. The Docker part, however, is not. As such, I will show you a basic Go application which mimics what we had to deal with and how to set up debugging for it.
The application
The following is the main.go of our app. It will connect to a Redis server, set and get a value.
package main


import (
    "fmt"


    "github.com/garyburd/redigo/redis"
)


func main() {
    client, err := redis.Dial("tcp", "redis:6379")
    if err != nil {
        panic(err)
    }
    defer client.Close()


    result, err := client.Do("SET", "key1", "value1")
    if err != nil {
        panic(err)
    }
    fmt.Printf("%v\n", result)


    result, err = client.Do("GET", "key1")
    if err != nil {
        panic(err)
    }
    fmt.Printf("%v\n", result)
}
As you can see, it relies on the Redigo package, so make sure you get it and place it in your vendor folder.
To make sure you have everything setup the right way, go ahead and build it locally by running :
go build -o main main.go
If you run the application built this way, it will fail of course, because you need to connect to Redis. I’ve set the hostname for the server to redis which will point to an IP on the docker-machine when we docker-compose up.
The Dockerfile
Now we have to build the image for this application.
FROM golang


ENV GOPATH /opt/go:$GOPATH
ENV PATH /opt/go/bin:$PATH
ADD . /opt/go/src/local/myorg/myapp
WORKDIR /opt/go/src/local/myorg/myapp


RUN go get github.com/derekparker/delve/cmd/dlv
RUN go build -o main main.go
CMD ["./main"]
When this image will be built, it will basically copy the application code, set up the environment and build the Go application. The application’s entrypoint will be the main executable that will be built. We also install the Delve command line tool but we won’t use it if we run a container from this image directly (i.e. docker run).
Note the GOPATH variable and the path to which we copy our code. This path is very important for Delve and our debug configuration.
The Docker Compose file
Now that we have the Dockerfile to build the image, we have to define the docker-compose.yml file. Here, however we will overwrite the entrypoint for the container to launch Delve. Also the code that we copied will be replaced with a volume that will point to the code on the host machine, and we will also remove some security constraints that prevent Delve from forking the process.
Essentially, for the context I mentioned above we try not to touch the base image for the application since it might get accidentally pushed to the Docker Hub with debugging parameters. So in order to avoid that we have our Docker Compose process override the image with what we need to go about debugging.
Here’s the docker-compose.yml file :
version: '2'
services:
  redis:
    image: redis
    ports:
      - "6379:6379"
    expose:
      - "6379"
  myapp:
    build: .
    security_opt:
      - seccomp:unconfined
    entrypoint: dlv debug local/myorg/myapp -l 0.0.0.0:2345 --headless=true --log=true -- server
    volumes:
      - .:/opt/go/src/local/myorg/myapp
    ports:
      - "2345:2345"
    expose:
      - "2345"
It's here that we introduce the Redis server dependency we have. Note that for the myapp container we’ve exposed the ports that the Delve command line tool listens to.
So to see that everything is working, you can now run :
docker-compose up --build
This will build the image and start up the redis and myapp containers.
You should see the following output coming from the myapp container:
myapp_1  | 2016/12/15 08:50:39 server.go:71: Using API v1
myapp_1  | 2016/12/15 08:50:39 debugger.go:65: launching process with args: [/opt/go/src/local/myorg/myapp/debug server]
myapp_1  | API server listening at: [::]:2345
Which means that the Delve command line tool compiled our Go code into a debug executable, started it, and it’s listening for remote connections to the debugger on port 2345.
Now we just have to set up our launch.json config in the .vscode folder of our project.
The launch configuration
Here’s how our launch.json should look like:
{
    "version": "0.2.0",
    "configurations": [
       {
           "name": "Remote Docker",
           "type": "go",
           "request": "launch",
           "mode": "remote",
           "remotePath": "/opt/go/src/local/myorg/myapp",
           "port": 2345,
           "host": "192.168.99.100",
           "program": "${workspaceRoot}",
           "env": {},
           "args": []
       }
    ]
}
You might have to change the host IP to what your docker-machine ip output is.
Now all we have to do is set up a few breakpoints and start the debugger using the Remote Docker configuration.
Our docker compose terminal should print something like this from the myapp container :
myapp_1  | 2016/12/15 08:50:45 debugger.go:242: created breakpoint: &api.Breakpoint{ID:1, Name:"", Addr:0x4010af, File:"/opt/go/src/local/myorg/myapp/main.go", Line:11, FunctionName:"main.main", Cond:"", Tracepoint:false, Goroutine:false, Stacktrace:0, Variables:[]string(nil), LoadArgs:(*api.LoadConfig)(nil), LoadLocals:(*api.LoadConfig)(nil), HitCount:map[string]uint64{}, TotalHitCount:0x0}
myapp_1  | 2016/12/15 08:50:45 debugger.go:242: created breakpoint: &api.Breakpoint{ID:2, Name:"", Addr:0x401116, File:"/opt/go/src/local/myorg/myapp/main.go", Line:16, FunctionName:"main.main", Cond:"", Tracepoint:false, Goroutine:false, Stacktrace:0, Variables:[]string(nil), LoadArgs:(*api.LoadConfig)(nil), LoadLocals:(*api.LoadConfig)(nil), HitCount:map[string]uint64{}, TotalHitCount:0x0}
myapp_1  | 2016/12/15 08:50:45 debugger.go:242: created breakpoint: &api.Breakpoint{ID:3, Name:"", Addr:0x4013d1, File:"/opt/go/src/local/myorg/myapp/main.go", Line:22, FunctionName:"main.main", Cond:"", Tracepoint:false, Goroutine:false, Stacktrace:0, Variables:[]string(nil), LoadArgs:(*api.LoadConfig)(nil), LoadLocals:(*api.LoadConfig)(nil), HitCount:map[string]uint64{}, TotalHitCount:0x0}
myapp_1  | 2016/12/15 08:50:45 debugger.go:397: continuing
You can Next and Continue, look at the callstack, see the locals, view contents of specific variables, etc.
Final thoughts
I hope this proves to be as useful to you as it did for us. The tools mentioned in this post really save us a heap of trouble.
We really have to thank the open source community that brought us these tools. They are the real heroes.
Happy debugging!


